Overview

DNA methylation research has always been a hot topic in disease research and is closely related to gene expression and phenotypic traits. RRBS is an accurate, efficient and economical method for DNA methylation research. Enrichment of promoter and CpG island regions by enzymatic cleavage (Msp I), combined with Bisulfite sequencing, provides high resolution DNA methylation detection.
Service SpecificationsApplications
Applications range from transcriptional regulation to developmental pathways to disease mechanisms and beyond.
For medical research:
- Pathological mechanism
- Tumor-subtypes classification
- Molecular markers
- Human evolution
- Drug target
For agricultural research:
- Development
- Adaptability
- Agronomic traits
Advantages
- Unsurpassed data quality: We guarantee that ≥ 80% of bases have a sequencing quality score ≥ Q30, exceeding Illumina’s official guarantee of ≥ 75%.
- Comprehensive data analysis: We use widely-accepted mainstream software such as Bismark and a mature in-house pipeline for mapping, Differentially Methylated Region (DMR) analysis, functional analysis and data visualization.
Sample Requirements
| Sample Type | Required amount | Purity |
| Genomic DNA | ≥ 1.5 μg | OD260/280=1.8-2.0 |
Sequencing Parameter and Analysis
| Platform Type | Illumina Novaseq 6000 |
| Read Length | Pair-end 150 |
| Recommended Sequencing Depth | ≥ 10Gb clean data per sample |
| Standard Data Analysis |
|
Note: For detailed information, please refer to the Service Specifications and contact us for customized requests.
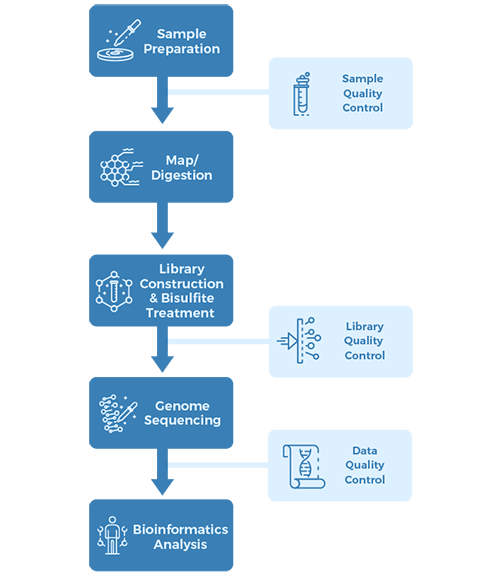
Project Workflow
Sampling & Sequencing Strategy:
1. Samples:
Postmortem brain samples from:
• depressed individuals who died by suicide with a history of severe child abuse, N=27
• depressed individuals who died by suicide without a history of severe child abuse, N=25
• psychiatrically healthy control subjects, N=26
2. Library preparation:
RRBS library and RNA-seq library
3. Sequencing:
Illumina platform, PE100 and SE50
4. Bioinformatics analysis:
Differential methylation analysis (RRBS) and Differential expression analysis (RNA sequencing)
Results & Conclusion:
Epigenetic Effects of Child Abuse
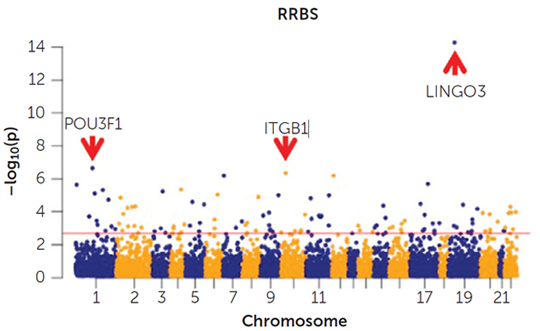
Figure 1. Epigenetic adaptations in the anterior cingulate cortex following child abuse.
1) Widespread differences of DNA methylation were uncovered between child abuse and control group.
Both hyper- and hypomethylation were detected in the child abuse group compared with the control group, suggesting that child abuse bidirectionally regulates epigenetic patterns in the cingulate cortex. The three most significantly differentially methylated regions intersected with genes directly related to myelin and oligodendrocytes: LINGO3, POU3F1 and ITGB1 (Fig. 1).
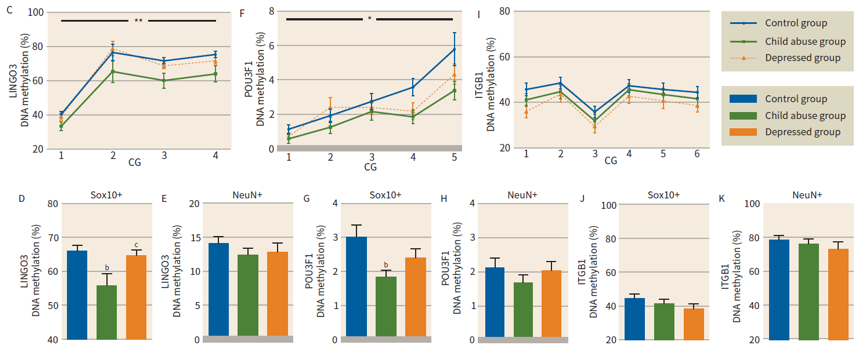
Figure 2. DNA methylation was measured in sorted populations of NeuN+ and Sox10+ nuclei, focusing on differentially methylated loci identified by RRBS.
2) DNA methylation patterns are cell type specific
For both LINGO3 and POU3F1 decreased methylation in the child abuse group was confirmed and found to occur specifically in oligodendrocyte, but not neuronal, nuclei. These effects were absent in the depressed group. However, no significant DNA methylation differences for ITGB1 in either Sox10+ or NeuN+ nuclei between groups (Fig. 2).
Reference: Lutz P, Tanti A, Gasecka A, et al. A ssociation of a History of Child Abuse with Impaired Myelination in the Anterior Cingulate Cortex: Convergent Epigenetic, Transcriptional, and Morphological Evidence[J]. American Journal of Psychiatry, 2017, 174(12): 1185-1194.
Figure 1 Distribution of genome coverage.png
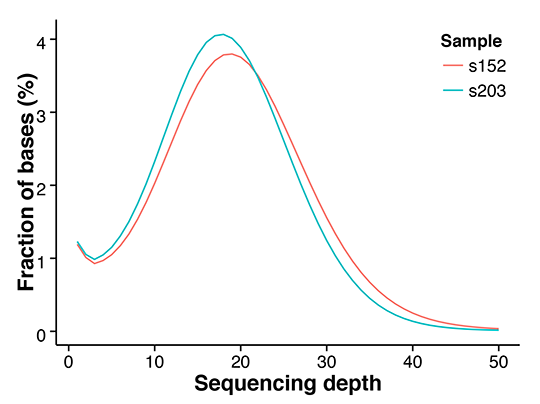
Figure 2 Methylation level distribution in whole genome.png
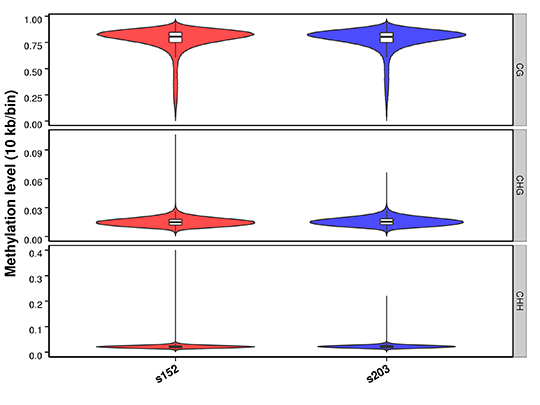
Figure 3 Circos plots for methylation density on chromosome.png
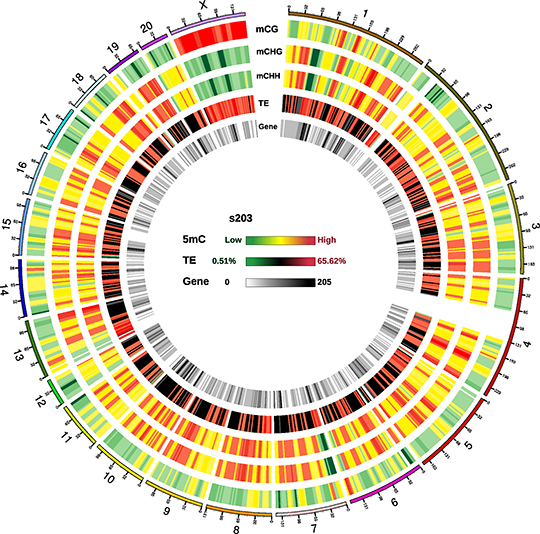
Figure 4 Heatmap analysis of gene functional region methylation levels-1.png
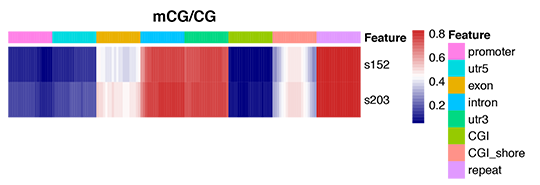
Figure 5 An overview of methylation level distribution at functional genetic elements.png
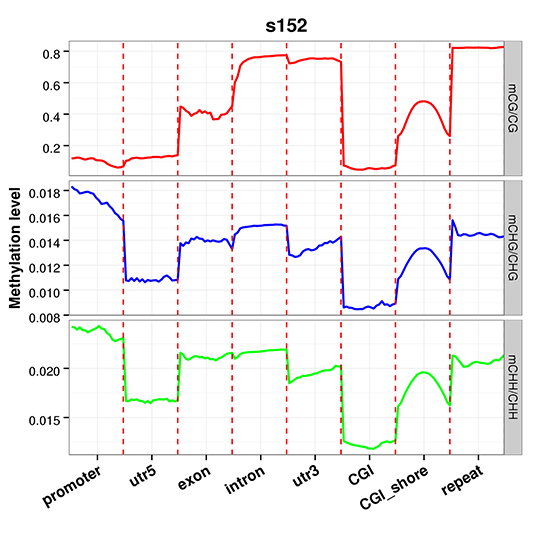
Figure 6 KEGG enrichment scatter.png