概要

DNA methylation at the C5 position of cytosine plays a crucial role in gene expression and chromatin remodeling. Perturbations in methylation patterns are implicated in tumorigenesis, neurodegenerative diseases and neurological disorders. Therefore, methylome analysis is an increasingly valuable research tool with a range of applications, including studies on gene regulation, cell differentiation, embryogenesis, aging, occurrence and development of disease, phenotypic diversity and evolution in plants and animals. Novogene provides whole genome sequencing of bisulfite-converted DNA as an effective method to identify individually methylated cytosines on a genome-wide scale. The deep reach of the methylome is vital to understanding gene expression and other processes that are subject to epigenetic regulation.
Service SpecificationsApplications
Applications range from transcriptional regulation to developmental pathways to disease mechanisms and beyond.
For medical research:
- Pathological mechanism
- Tumor-subtypes classification
- Molecular markers
- Human evolution
- Drug target
For agricultural research:
- Development
- Adaptability
- Agronomic traits
Advantages
- Extensive experience: Hundreds of projects successfully completed by a bioinformatics analysis team composedof Ph.D. scientists entirely.
- Unsurpassed data quality: We guarantee that ≥ 80% of bases have a sequencing quality score ≥ Q30, exceeding Illumina’s official guarantee of ≥ 75%.
- Comprehensive data analysis: We use widely-accepted mainstream software such as Bismark and a mature in-house pipeline for mapping, Differentially Methylated Region (DMR) analysis, functional analysis and data visualization.
Sample Requirements
| Sample Type | Required amount | Purity |
| Genomic DNA | ≥2.5 μg | OD260/280=1.8-2.0 |
Sequencing Parameter and Analysis
| Platform Type | Illumina Novaseq 6000 |
| Read Length | Paired-end 150 |
| Recommended Sequencing Depth | ≥ 30× coverage for the species with reference genome |
| Standard Data Analysis |
|
Note: For detailed information, please refer to the Service Specifications and contact us for customized requests.
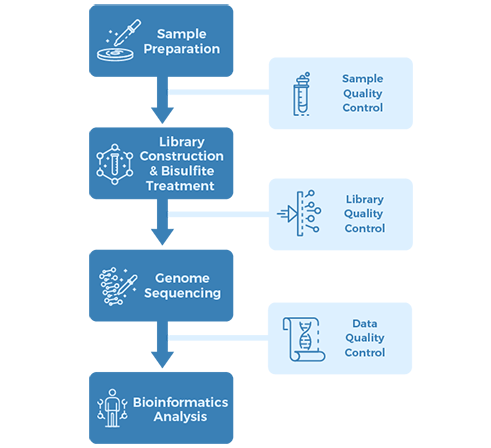
Project Workflow
Sampling & Sequencing Strategy:
2.1. Samples:
Four patient-matched CAF-NPF pairs (eight samples), and LNCaP and PrEC cell lines
2.2. Library preparation:
WGBS library and RNA-seq library
2.3. Sequencing:
Illumina HiSeq, PE100 and PE75
2.4. Bioinformatics analysis:
WGBS standard analysis and gene expression analysis
Results & Conclusion:
Functional DMRs define cell-type specificity between CAFs and NPFs across independent patients
We selected 14 candidate genes with coordinated changes in methylation and expression and known roles in prostate cancer and/or the tumor microenvironment. All candidate regions showed a significant change in methylation (P < 0.05) in agreement with the WGBS data. Methylation levels at individual DMRs also discriminated between CAFs and NPFs, including HOXD8 with AUC = 1. We also found that 13 of 14 candidate genes were significantly differentially expressed in CAFs versus NPFs (P < 0.05). There was a strong negative correlation between expression and methylation for IGFBP2, ITGA11, ESR1, and EPHB6, all of which have DMRs downstream from their promoter. In contrast, there were strong positive correlations for PITX2, with a DMR in the last intron, and HOXD8 and EBF1, which have intergenic DMRs, suggesting a mechanistic link between methylation and expression at these loci. Collectively, our genome-wide and targeted validation, in independent patients, demonstrate that DE-DMRs are highly consistent between patients and define cell-type specificity between CAFs and NPFs (Firgure 1.).
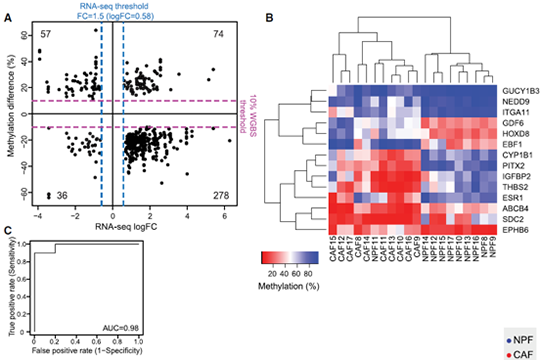
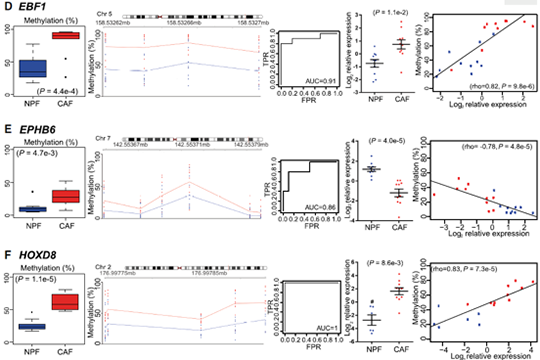
Figure 1. Consistent changes in DMRs associated with differentially expressed genes (DE-DMRs) between patients.
Figure 1 Distribution of genome coverage
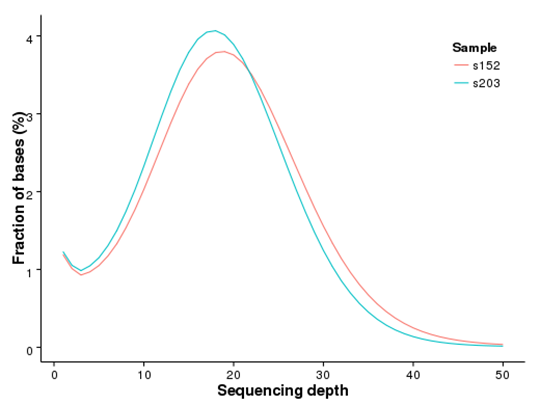
Figure 2 Methylation level distribution in whole genome
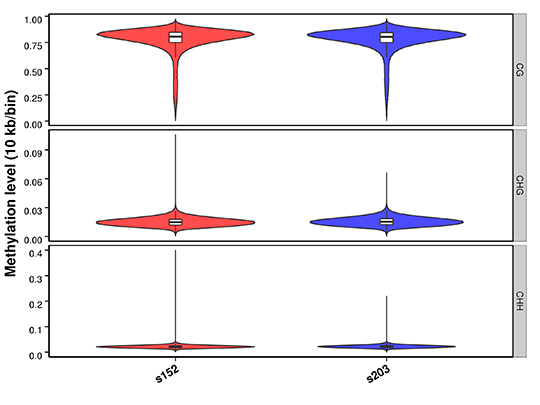
Figure 3 Heatmap analysis of gene functional region methylation levels
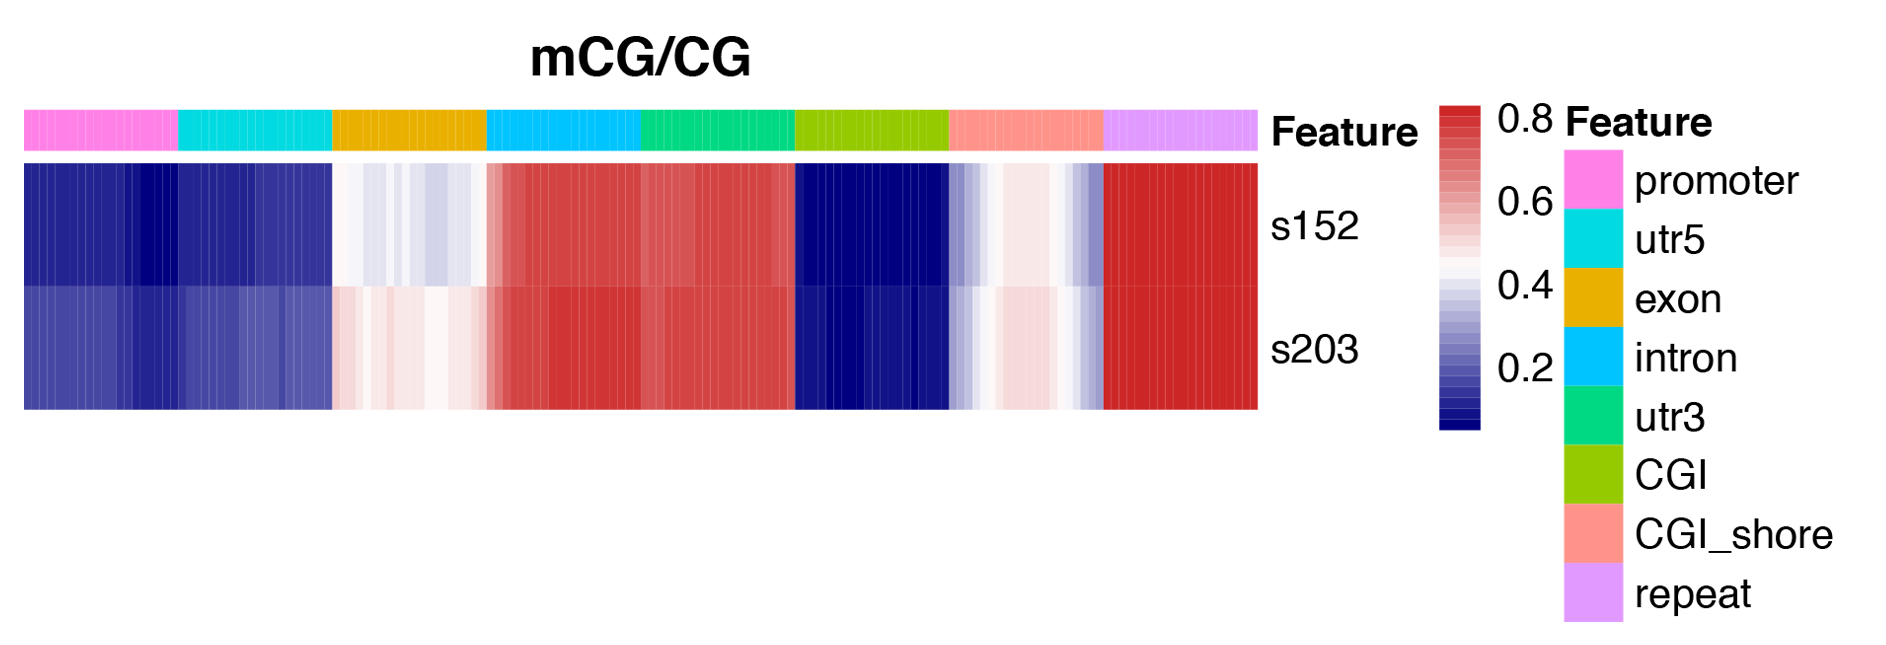
Figure 4 An overview of methylation level distribution at functional genetic elements
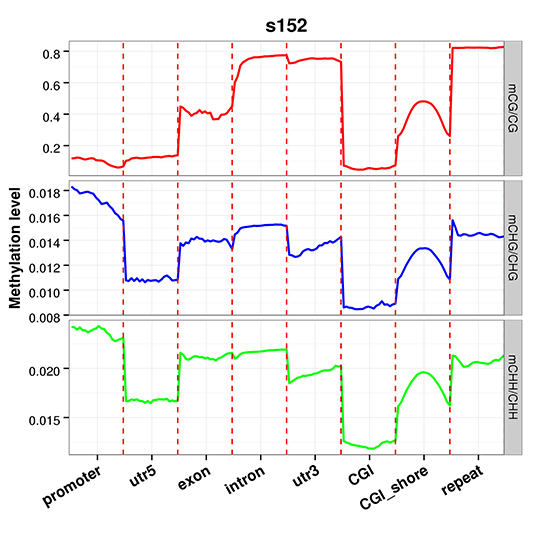
Figure 5 Circos plot for DMR condition in three contexts (CG, CHG, CHH)
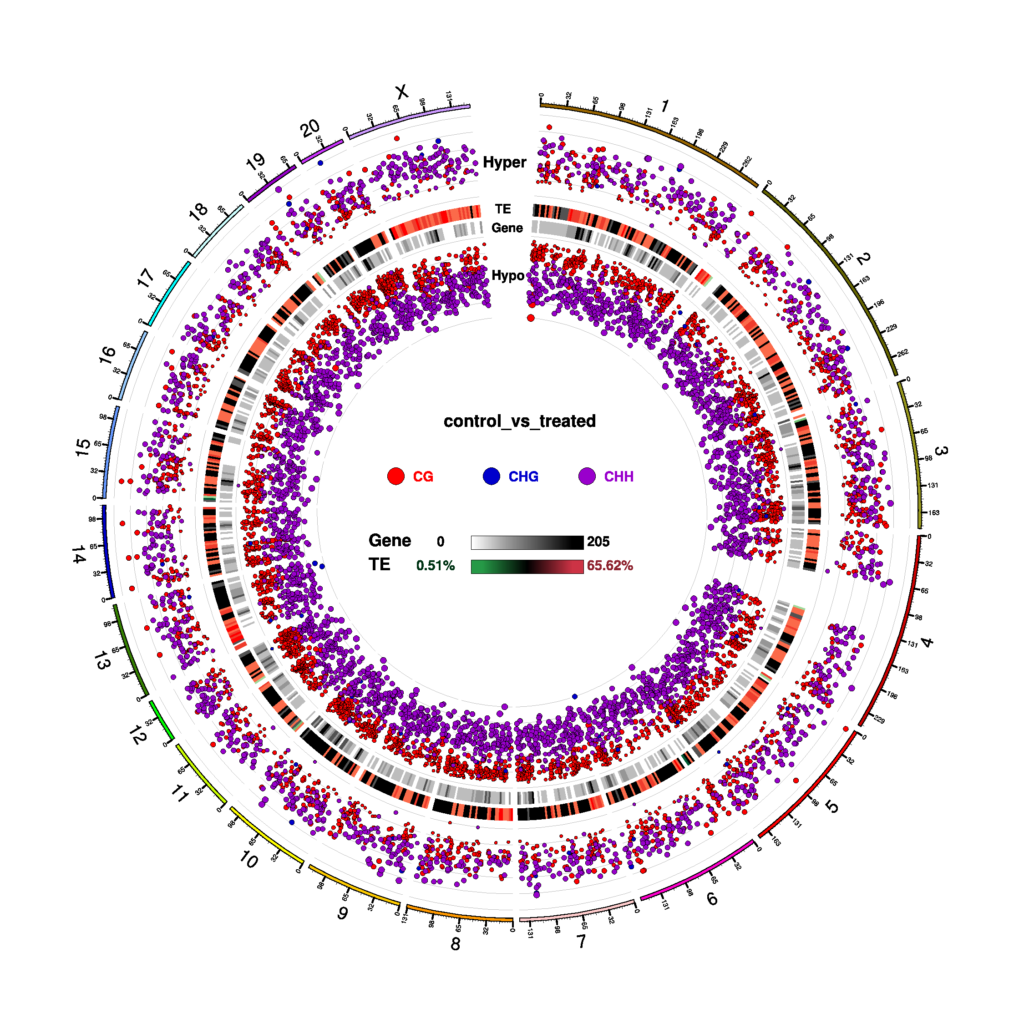
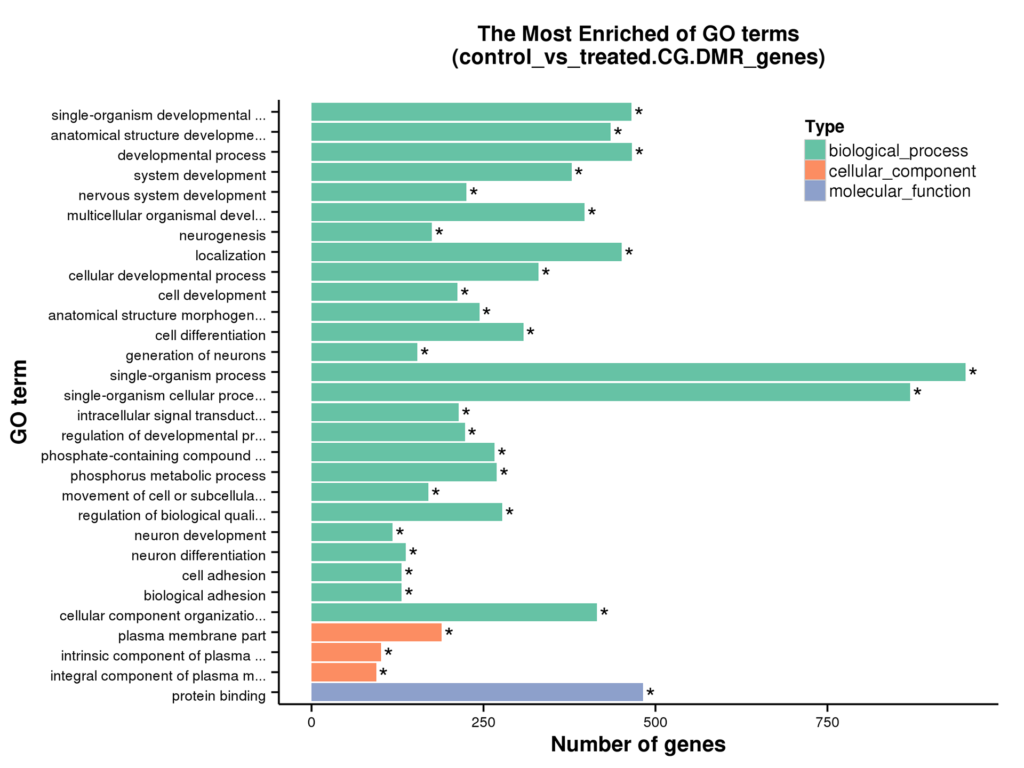
Figure 6 GO enrichment